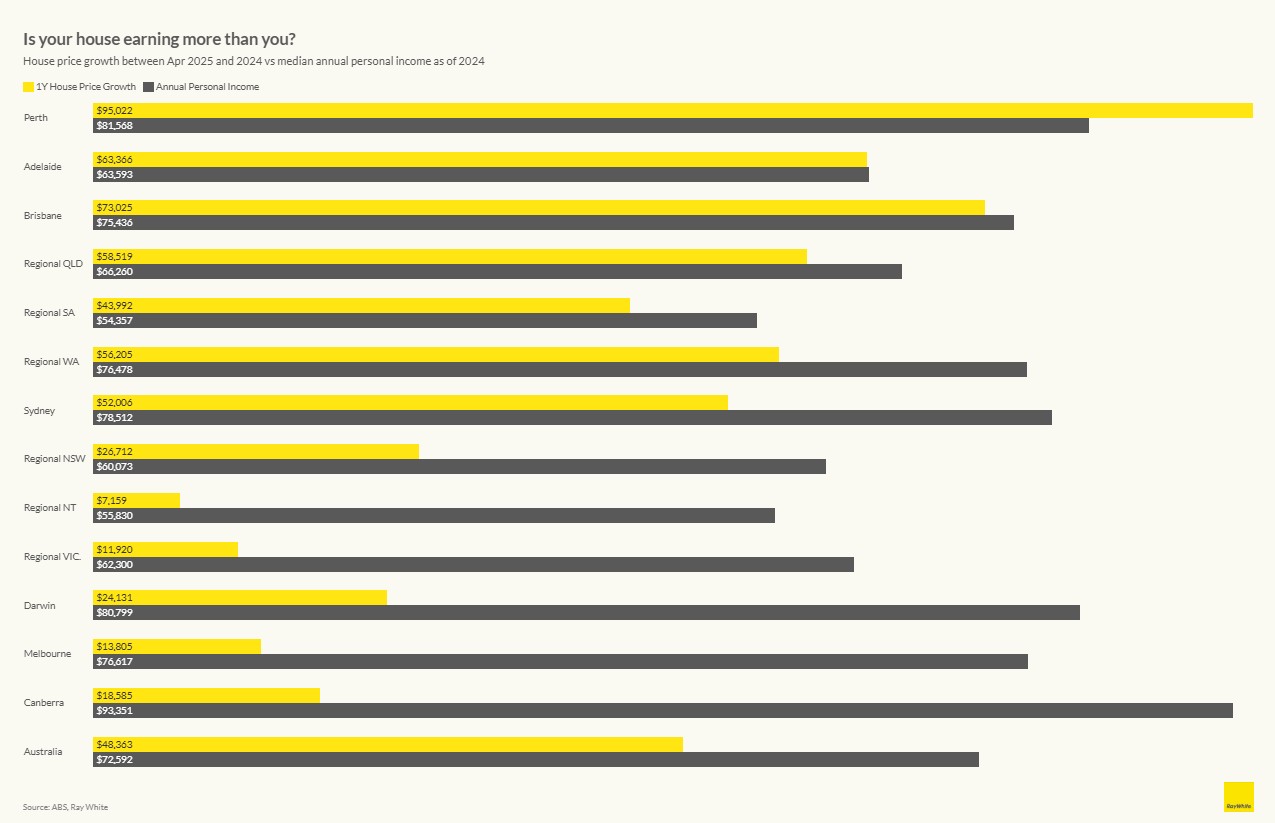
Between April 2024 and April 2025, Aussie house prices jumped from $871,671 to $918,296. Meanwhile, our median annual income sat at $72,592 – that’s 1.5 times more than the $46,625 our houses quietly made for us over the year.
The real winner
Perth is the only place where houses earned more than people. In fact, Perth residents seem to have it best. Not only do they earn the second highest annual income across the country, but their houses made the biggest gains in the last 12 months. Perth house prices surged by $95,022, climbing from $812,482 to $907,504. Even Canberra with annual incomes of $93,351 couldn’t match what Perth houses made.
How do other cities compare?
In Adelaide, it’s neck and neck with both annual personal income and house price growth sitting at just over $63,000. Brisbane homeowners are just keeping their noses in front, earning roughly $2,000 more than their houses appreciated. However, the gap widens from here. Melbourne and Canberra have the greatest disparity between personal income and house price growth – Melbournians made 5.5 times more than their properties, while Canberrans pulled in 5 times what their houses did.
On the extremes: Big earners picking up the slack
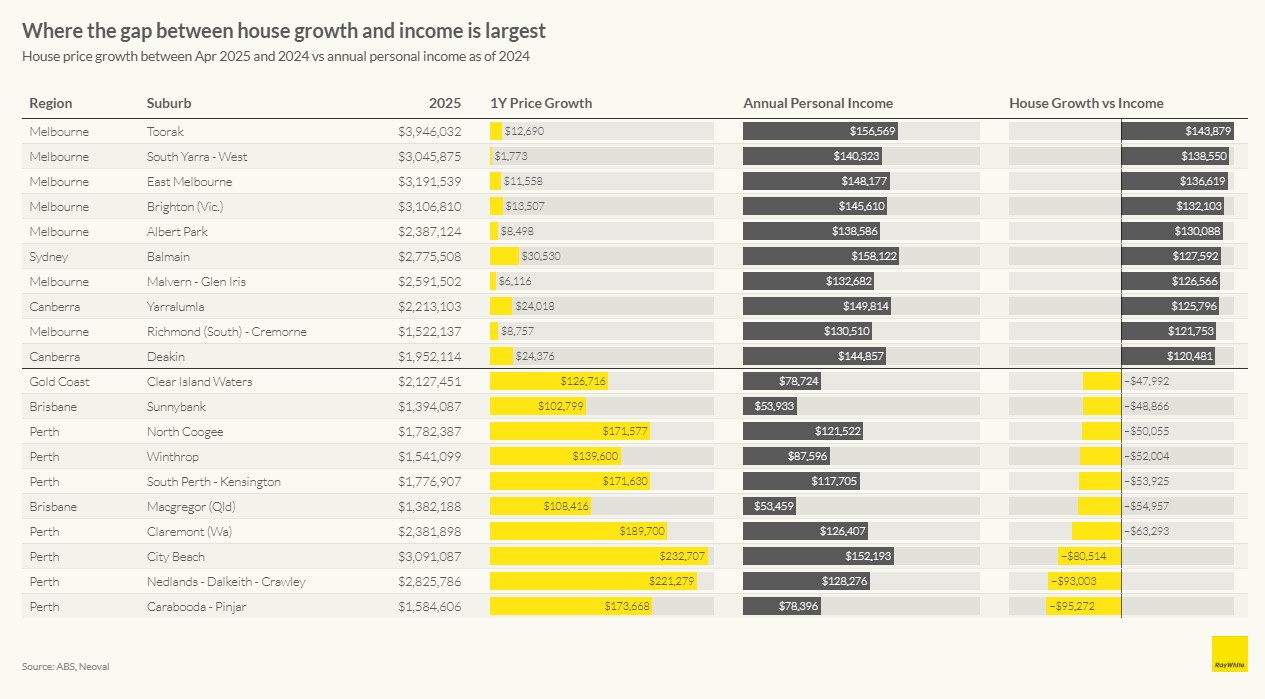
It is no surprise then that Melbourne dominates the list of suburbs where people earn more than their houses. The only non-Melbourne suburbs on this list are Balmain (Sydney), Yarralumla and Deakin (both in Canberra). What’s striking is these are all wealthy suburbs with annual incomes between $130,000-$156,000 – double Australia’s median.
This is the opposite of what we would expect. Typically, house values grow faster than incomes in expensive areas, and incomes outpace house growth in more affordable areas. Four years ago, during the last census, 78 per cent of suburbs where people out-earned their homes were in regional areas with average house prices of $360,000. Today, the suburbs where you earn more than your house have prices between $1.9-3.9 million.
The wealth shift
On the flip side, Perth dominates the list where houses earn more than people. The only non-Perth suburbs on this list are Clear Island Waters (Gold Coast), Sunnybank and Macgregor (both in Brisbane). Here, income patterns are more varied, ranging from $53,000 to $152,000.
What’s especially telling is the range of house prices. Even among Perth’s strongest performers, house prices remain relatively accessible compared to Sydney and Melbourne. For example, Macgregor in Brisbane (where houses outperformed incomes) have house prices of just $1.38 million-less than half of Melbourne’s Toorak at $3.94 million.
This shows a major market shift. Previously, Sydney’s Eastern and Northern suburbs led Australia for house price growth, outpacing local incomes by 6-8 times. Now those luxury markets have cooled, and growth has moved to mid-tier markets in Perth, Gold Coast and Brisbane as buyers seek better value.
Methodology: How we compared income with house price growth
For house prices, we used geometric mean house price data from our partners at Neoval, comparing April 2024 to April 2025. For income data, we started with the Australian Bureau of Statistics (ABS) 2021 Census data, which provides median weekly income by suburb. To bring these figures up to date, we applied state-level income growth rates from ABS’s annual reports. For example, in Toorak, the 2021 Census showed a median weekly income of $2,541. Victoria’s income grew by 18.5 per cent between 2021 and 2024, so we calculated Toorak’s 2024 weekly income as $3,011. We then multiplied by 52 to get the annual income of $156,569.
